Shares of Gener8 Maritime, Inc. (NYSE: GNRT) are on the rise following a Wall Street Journal report that tanker company Frontline (FRO), the company owned by Norwegian billionaire John Fredriksen is discussing an acquisition or merger with the company. A deal would create the largest tanker fleet in the world, with 43 large crude carriers in operation. A source told the WSJ that while talks are progressing, there is no promise of a deal going through.
Frontline had previously sought a merger with DHT Holdings (DHT), offering .8 shares of FRO for each share of DHT. That offer was rejected by the DHT board of directors on May 7th. Fredriksen’s Frontline has abandoned its pursuit of DHT Holdings with the Norwegian tycoon now possibly attempting a union with Peter Georgiopoulos and Gener8 Maritime. A deal between Fredriksen and Georgiopoulos is understood to be under discussion and any transaction would create a deal which was first on the table over a decade ago, when Frontline made an unsuccessful play for Gener8 forerunner General Maritime.
Company Description
![]()
Gener8 Maritime, Inc. engages in the transportation of international seaborne crude oil and petroleum products. As of March 13, 2017, it owned a fleet of 41 vessels, including 25 very large crude carriers, 10 suezmax vessels, 4 aframax vessels, and 2 panamax vessels, with an aggregate carrying capacity of 9.7 million deadweight tons. The company was formerly known as General Maritime Corporation and changed its name to Gener8 Maritime, Inc. in May 2015. Gener8 Maritime, Inc. was founded in 1997 and is based in New York, New York.
GNRT has one of the youngest fleets in the industry. The deadweight weighted average of their fleet will soon be 4.9 years and the average age of their VLCC fleet will be 2.7 years. This will give Gener8 one of the youngest and most modern fleets of VLCCs in the world.
Q1 Corporate Highlights
- Recorded net income of $26.9 million, or $0.32 basic and diluted earnings per share, for the three months ended March 31, 2017, compared to $60.9 million, or $0.74 basic and diluted earnings per share for the same period in the prior year. Recorded adjusted net income of $38.5 million, or $0.46 basic and diluted adjusted earnings per share, for the three months ended March 31, 2017, compared to $64.8 million or $0.78 basic and diluted earnings per share for the same period in the prior year.
- Increased vessel operating days by 24.4% to 3,510 in the three months ended March 31, 2017 compared to 2,822 in the same period in the prior year. Increased full fleet “ECO” operating days to 49% in the three months ended March 31, 2017, compared to 20% in the same period in the prior year.
- Took delivery of two “ECO” newbuilding VLCCs, the Gener8 Hector and the Gener8 Ethos during the three months ended March 31, 2017.
- Sold the 2003-built VLCC tanker Gener8 Ulysses in February 2017 for net proceeds of $10.2 million after prepaying $20.0 million of associated debt.
- Entered into a series of transactions subsequent to the end of the quarter that are expected to increase cash on the balance sheet by more than $82 million. These include:
- Modified the Company’s interest rate swap agreements, which resulted in aggregate net cash proceeds of $18.2 million in April 2017.
- Entered into agreements to sell two 2016-built VLCCs, the Gener8 Noble and the Gener8 Theseus, for expected combined gross proceeds of $162 million and expected net cash increase of $61.5 million following prepayment of debt and the release of working capital from the pool.
- Entered into agreement to sell the 2002-built Aframax tanker Gener8 Daphne prior to the vessel’s special survey.
(Source: Company presentation)
First Quarter 2017 Results Summary
The Company recorded net income for the three months ended March 31, 2017 of $26.9 million, or $0.32 basic and diluted earnings per share, compared to net income of $60.9 million, or $0.74 basic and diluted earnings per share, for the prior year period.
Adjusted net income was $38.5 million, or $0.46 basic and diluted adjusted earnings per share, for the three months ended March 31, 2017, compared to adjusted net income of $64.8 million, or $0.78 basic and diluted adjusted income per share, for the prior year period.
Adjusted EBITDA for the three months ended March 31, 2017 was $86.0 million, compared to $87.7 million for the prior year period.
The average daily spot TCE rates obtained by the Company’s VLCC fleet, including its vessels that were deployed in the Navig8 pools, were $43,143 for the three months ended March 31, 2017. During the three months ended March 31, 2017, the Company’s “ECO” VLCC fleet earned an average daily TCE of $43,965, and the Company’s non-“ECO” VLCC fleet earned an average daily TCE of $39,343. The average daily TCE rate obtained by the Company on a full-fleet basis was $34,493 during the three months ended March 31, 2017, compared to $43,119 for the prior year period.
Net voyage revenue was $121.1 million for the three months ended March 31, 2017, substantially unchanged as compared to $121.7 million in the prior year period. A decrease in average daily fleet TCE rate resulted in a decrease in net voyage revenue of approximately $24.3 million for the three months ended March 31, 2017 compared to the prior year period. The decrease in net voyage revenues was partially offset by an increase in the Company’s vessel operating days by 688 days, or 24.4%, to 3,510 days, compared to 2,822 days for prior year period. The increase in the Company’s vessel operating days resulted in an increase in net voyage revenue of approximately $23.7 million for the three months ended March 31, 2017 compared to the prior year period. The increase in the Company’s vessel operating days was primarily the result of the deployment of 12 additional VLCC newbuilding vessels since the end of the prior year period.
Direct vessel operating expenses, which include crew costs, provisions, deck and engine stores, lubricating oil, insurance, and maintenance and repairs, increased by $4.3 million, or 17.3%, to $28.8 million for the three months ended March 31, 2017 compared to $24.5 million for the prior year period. The increase in direct vessel operating expenses was primarily due to the increase by 8.8 vessels, or by 28.8%, in the average size of the Company’s fleet to 39.5 vessels for the three months ended March 31, 2017, as compared to 30.7 vessels for the prior year period. The increase in direct vessel operating expenses was partially offset by a decrease in daily direct vessel operating expenses per vessel of $701, or 8.0%, to $8,081 per day for the three months ended March 31, 2017 compared to $8,782 per day for the prior year period, primarily as a result of lower operating costs, including crew cost, repair and maintenance and other costs, associated with the Company’s newly delivered vessels.
Navig8 charterhire expenses of $6.0 thousand for the three months ended March 31, 2017 comprised of profit share adjustments related to the profit share plan for Nave Quasar, a vessel chartered-in by Gener8 Maritime Subsidiary Inc. (formerly known as Navig8 Crude Tankers, Inc.), which became a subsidiary as a result of the 2015 merger.
General and administrative expenses increased by $0.3 million, or 4.2%, to $8.4 million during the three months ended March 31, 2017 compared to $8.1 million for the prior year period. The increase was primarily due to a net increase in the stock-based compensation expense of $0.6 million during the three months ended March 31, 2017 compared to the prior year period, partially offset by a decrease of $0.3 million in legal expense and other professional fees, primarily associated with the Company’s refinancing activities as well as other matters that occurred in the prior year period.
Depreciation and amortization expenses increased by $10.2 million, or 58.4%, to $27.7 million during the three months ended March 31, 2017 compared to $17.5 million for the prior year period. Depreciation of vessel costs increased by $10.4 million, or 66.7%, to $26.0 million during the three months ended March 31, 2017 compared to $15.6 million for the prior year period. This increase was primarily due to an increase in the Company’s fleet size compared to the prior year period.
Loss on disposal of vessels, net increased by $9.7 million during the three months ended March 31, 2017 compared to $0.1 million for the prior year period, as the Gener8 Daphne and the Gener8 Elektra were moved to assets held for sale.
Net interest expense increased by $12.8 million to $20.1 million for the three months ended March 31, 2017 compared to $7.3 million for the prior year period. The increase was primarily attributable to the decrease in capitalized interest of $8.4 million, or 85.7%, to $1.4 million compared to $9.8 million for the prior year period related to the capitalization of interest expense associated with vessels under construction as a result of the funding of the acquisition of the Company’s VLCC newbuildings. Capitalized interest results in a reduction of interest expense, net. The Company does not capitalize interest expense associated with the funding of the Company’s VLCC newbuildings after delivery of the vessels. Contributing to the increase in interest expense, net during the three months ended March 31, 2017, was an increase in interest expense associated with the Company’s credit facilities of $4.0 million, or 48.6%, to $12.4 million compared to $8.4 million for the prior year period due to the increase in outstanding borrowings under the Company’s credit facilities and senior notes. The Company’s outstanding borrowings under its credit facilities and senior notes were $1.6 billion and $1.2 billion as of March 31, 2017 and 2016, respectively. In addition, in May 2016, the Company entered into six interest rate swap transactions that effectively fix the interest rate on a portion of its outstanding variable rate debt to a range of fixed rates. During the three months ended March 31, 2017, the Company recorded $0.8 million related to interest rate swaps settlements as interest expense, net.
Also contributing to the increase in interest expense, net was an increase in amortization of deferred financing costs of $0.7 million, or 30.0%, to $3.2 million for the three months ended March 31, 2017 compared to $2.4 million for the prior year period. These increases in interest expense, net was partially offset by a decrease in commitment fees of $1.6 million, or 85.7% to $0.3 million for the three months ended March 31, 2017 compared to $1.9 million for prior year period.
The Company incurred these additional deferred financing costs and commitment fees in connection with its entry into the refinancing credit facility, which refinanced its former senior secured credit facilities, and the Amended Sinosure Credit Facility and the Korean Export Credit Facility, which it has used to fund a portion of the installment payments due under the its VLCC newbuildings contracts.
During the three months ended March 31, 2017, the Company’s interest rate swap agreements were highly effective; the Company recognized $0.7 million of earnings, as other (expense) income, net, related to the impact of its interest rate swap agreements.
As of March 31, 2017, the Company’s cash balance was $143.4 million, compared to $94.7 million as of December 31, 2016. As of March 31, 2017, the Company’s total debt was $1.6 billion and net debt was $1.4 billion.
As of March 31, 2017, there were 82,960,194 shares of the Company’s common stock outstanding.
(Source: Company presentation)
Risk Factors
An over‑supply of tanker capacity may lead to weakness or reductions in charter rates, vessel values.
The tanker industry has experienced volatility in charter rates and vessel values, and further declines may have an adverse effect on the carrying value of vessels and affect compliance with loan covenants.
Global financial markets may adversely impact the ability to obtain additional financing.
Any decrease or weakness in shipments of crude oil may adversely affect financial performance.
Stock Analysis
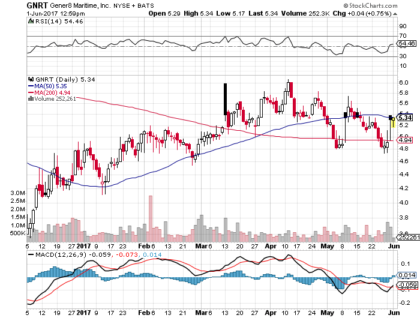
Shares of Gener8 Maritime were at $5.32, up 8.35% on Wednesday May 31, 2017. The current RSI (14) is 53.87. GNRT shares are trading below their 50-day moving average of $5.35 and above their 200-day moving average of $4.94. Trading volume was at 812K shares vs an average daily volume of 586 thousand shares.
Summary
The market cap of a company is its share price multiplied by the number of shares outstanding. GNRT has a current market cap of about $435 Million. Enterprise value is calculated as the market cap plus debt, minority interest and preferred shares, minus total cash and cash equivalents and is a better indicator of the cost to acquire a company. Gener8 Maritime Inc.’s enterprise value is approximately $1.84 Billion due in large part to its $1.3 Billion in long term debt. Multiple sources place the book value of Gener8 at $17.60/share or just under $1.5 Billion.
The balance sheets of GNRT and FRO are eerily similar in scope. Respectively, cash is $94M vs $203M, long term debt is $1.3B vs $1.28B, shareholder equity is $1.43B vs $1.49B and both show assets of about $3billion (as at 12-31-16). Given the modest cash position at both companies, a cash buyout seems unlikely. Negotiations will likely be focused on the two company’s debt holders. The combination of GNRT and FRO would create a behemoth shipping company with $6 billion in assets.
Disclaimer
Traders News Source is a wholly owned subsidiary of Traders News Source LLC, herein referred to as TNS LLC.
Traders News Source has not been compensated for this report by anyone and the opinions if any are that of the author Mark Roberts. Author’s Disclosure: I have no positions in any stocks mentioned, and no plans to initiate any positions within the next 72 hours. I, wrote this article myself, and it expresses my own opinions. I have no business relationship with any company whose stock is mentioned in the article.
This web site, published by TNS LLC, and is an investment newsletter that is built on the premise of assisting individual investors in learning about investing. Our goal as publishers of financial information is to provide research and analysis of investments to our subscribers. TNS LLC does not give buy or sell recommendations. We do purchase distribution rights from analyst, financial writers and bloggers for a fee that may be licensed to issue price targets and recommendations. Furthermore, we encourage you to speak to a licensed professional prior to making an investment in any type of publicly traded security.
We do sell advertising to other companies including brokerage firms, web sites, publicly traded issuers, investor relations firms, and investment publications, among others. TNS LLC makes no warranty as to the policies of these organizations, and in no way endorses their offers, services, or the content of their advertisements.
When an advertiser is a publicly traded company or a third party acting on behalf of a public company, we fully disclose all compensation in the email advertisement. Such disclosure is included in a disclosure statement in each of the advertisements sent via email.
17B Disclosure
Our reports/releases are a commercial advertisement and are for general information purposes ONLY. We are engaged in the business of marketing and advertising companies for monetary compensation. Never invest in any stock featured on our site or emails unless you can afford to lose your entire investment. The disclaimer is to be read and fully understood before using our services, joining our site or our email/blog list as well as any social networking platforms we may use.
PLEASE NOTE WELL: TNS LLC and its employees are not a Registered Investment Advisor, Broker Dealer or a member of any association for other research providers in any jurisdiction whatsoever.
Release of Liability: Through use of this website viewing or using you agree to hold TNS LLC, its operator’s owners and employees harmless and to completely release them from any and all liability due to any and all loss (monetary or otherwise), damage (monetary or otherwise), or injury (monetary or otherwise) that you may incur. The information contained herein is based on sources which we believe to be reliable but is not guaranteed by us as being accurate and does not purport to be a complete statement or summary of the available data. TNS LLC encourages readers and investors to supplement the information in these reports with independent research and other professional advice. All information on featured companies is provided by the companies profiled, or is available from public sources and TNS LLC makes no representations, warranties or guarantees as to the accuracy or completeness of the disclosure by the profiled companies. None of the materials or advertisements herein constitute offers or solicitations to purchase or sell securities of the companies profiled herein and any decision to invest in any such company or other financial decisions should not be made based upon the information provide herein. Instead TNS LLC strongly urges you conduct a complete and independent investigation of the respective companies and consideration of all pertinent risks. Readers are advised to review SEC periodic reports: Forms 10-Q, 10K, Form 8-K, insider reports, Forms 3, 4, 5 Schedule 13D.
TNS LLC is compliant with the Can Spam Act of 2003. TNS LLC does not offer such advice or analysis, and TNS LLC further urges you to consult your own independent tax, business, financial and investment advisors. Investing in micro-cap and growth securities is highly speculative and carries an extremely high degree of risk. It is possible that an investor’s investment may be lost or impaired due to the speculative nature of the companies profiled.
The Private Securities Litigation Reform Act of 1995 provides investors a ‘safe harbor’ in regard to forward-looking statements. Any statements that express or involve discussions with respect to predictions, expectations, beliefs, plans, projections, objectives, goals, assumptions or future events or performance are not statements of historical fact may be “forward looking statements”. Forward looking statements are based on expectations, estimates, and projections at the time the statements are made that involve a number of risks and uncertainties which could cause actual results or events to differ materially from those presently anticipated. Forward looking statements in this action may be identified through use of words such as “projects”, “foresee”, “expects”, “will”, “anticipates”, “estimates”, “believes”, “understands”, or that by statements indicating certain actions & quote; “may”, “could”, or “might” occur.
Understand there is no guarantee past performance will be indicative of future results. In preparing this publication, TNS LLC has relied upon information supplied by its customers, publicly available information and press releases which it believes to be reliable; however, such reliability cannot be guaranteed. Investors should not rely on the information contained in this website. Rather, investors should use the information contained in this website as a starting point for doing additional independent research on the featured companies. The advertisements in this website are believed to be reliable, however, TNS LLC and its owners, affiliates, subsidiaries, officers, directors, representatives and agents disclaim any liability as to the completeness or accuracy of the information contained in any advertisement and for any omissions of materials facts from such advertisement. TNS LLC is not responsible for any claims made by the companies advertised herein, nor is TNS LLC responsible for any other promotional firm, its program or its structure.