Goldfield Corporation (NYSE: GV), is a leading provider of electrical construction and maintenance services in the energy infrastructure industry primarily in the Southeast and mid-Atlantic regions of the United States and Texas. The company specializes in installing and maintaining electrical transmission lines for a wide range of electric utilities. Goldfield is also a real estate developer of residential properties on the east coast of Florida. The Goldfield Corporation was founded in 1906 and is based in Melbourne, Florida. The company’s Common Stock is the longest traded security on the NYSE MKT LLC and its predecessor exchanges, having commenced trading 111 years ago.
FYE and Fourth Quarter Results – December 31, 2016
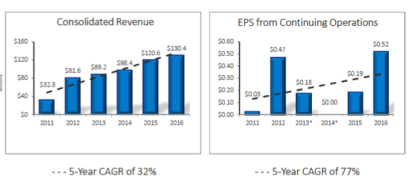
The company reported record revenues for the fifth consecutive year stating revenue increased 8.2% to a record $130.4 million from $120.6 million for the previous year. The increase was attributed to continued growth in fixed-price contracts and other electrical construction work.
Additional financial highlights:
- Income from continuing operations before taxes increased 155.0% to $20.9 million from $8.2 million, fueled by a 93.2% growth in electrical construction operations.
- Net income grew to a record $13.0 million, or $0.51 per share, from $4.5 million, or $0.18 per share.
- Margins on electrical construction operations income increased to 19.7% from 11.0% due to improved performance on several projects.
- EBITDA grew to $27.6 million from $14.9 million as a result of the same factors which drove the growth in pre-tax operating income.
(SOURCE: COMPANY REPORTS)
Goldfield’s President and Chief Executive Officer John H. Sottile said, “We are proud of our accomplishments in 2016, as revenue grew 8.2% and earnings per share improved 183% over 2015. In 2016, we also realized our fifth consecutive year of record revenues. We believe that the strategies which helped us achieve these milestones will continue to serve us well. Additionally, over the past five years our revenue has grown nearly 300 percent while earnings improved from $0.03 per share to $0.51 per share. This demonstrates our ability to grow our business, strengthen our operations and deliver results to our stockholders while successfully and safely executing projects and meeting the needs of our customers. We anticipate continuing strength in infrastructure spending, particularly in transmission construction, and believe we are well positioned to secure new projects in our markets.”
Goldfield operates in a stable industry, energy construction and maintenance. Their growing revenues and consistent margins are due mainly to its strong geographic footprint in the Southeast and mid-Atlantic regions of the United States and Texas, combined with a large modern fleet of equipment in each of its locations that maximize efficiency and minimize downtime.
While the electrical construction business remains highly competitive and fragmented, Goldfield provides services through its subsidiaries, Power Corporation of America, Southeast Power Corporation and C and C Power Line, Inc and it’s important to note that the company derives a significant portion of its electrical construction revenue from just a small group of customers. For example, for the years ended December 31, 2016 and 2015, three of its customers accounted for approximately 58% and 62% of consolidated revenue.
The company’s form 10-K shows customers including:
- Santee Cooper (South Carolina Public Service Authority)
- Florida Power & Light Company
- CPS Energy
- Lower Colorado River Authority
- Central Electric Power Cooperative, Inc
- Duke Energy Corporation
- Orlando Utilities Commission
- Lee County Electric Cooperative
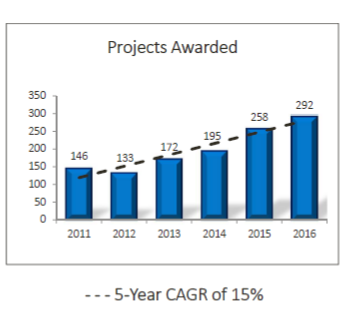
Goldfield has the reputation of retaining customers and completing its projects in a timely manner, based mainly on its policy of committing only to work that the company believes it can properly supervise, equip and complete to the customer’s satisfaction. The company’s latest investor presentation shows Goldfield has a 5 year CAGR of 15% when it comes to projects awarded.
(SOURCE: COMPANY REPORTS)
Backlog
Total backlog, which includes total revenue estimated over the remaining life of a master service agreement (MSA) plus estimated revenue from fixed-price contracts, was $190.0 million as of December 31, 2016, compared to $202.9 million as of year-end 2015. This decline resulted from completion of some MSA work, not replaced by new work and the reduction in estimated work under certain MSAs.
Potential Stock Influences
In addition to its backlog, Goldfield is also positioned to capitalize on some favorable industrial trends, which include:
- President Trump’s plan to prioritize and jumpstart infrastructure projects around the country
- Competitive transmission solicitations spurred by FERC 1000 ruling https://www.ferc.gov/industries/electric/indus-act/trans-plan.asp
- Growing need for additional transmission to deliver new generation of natural gas and renewable energy resources to load centers
- Federal programs, including wind and solar projects, will increase infrastructure spending
Plus some region trends that include:
Duke Energy:
- Constructing two 280-megawatt combined-cycled natural gas units in Asheville, NC to replace one 376-megawatt coal plant to be retired in 2020
- Building a 1,640 megawatt combined-cycle natural gas plant in Florida to replace two 1960s-era coal plants
Florida Power & Light:
- Strategically phasing out older, less efficient oil and coal-fired plants and replacing with advanced, fuel-efficient energy centers
- Investing to increase use of zero emissions solar power with plans to install significantly more solar panels every year through at least 2020
EEI Investments
In addition to President Trump’s plan to prioritize and jumpstart infrastructure projects around the country, there’s another catalyst that should continue to drive growth for Goldfield, and that is the projected transmission investments by EEI members.
The Edison Electric Institute (EEI) is the association that represents all U.S. investor-owned electric companies. Its members provide electricity for 220 million Americans, operate in all 50 states and the District of Columbia, and directly and indirectly employ more than one million workers.
EEI member investments range from new relatively large-scale, high-voltage facilities to investments in upgrades and replacement of existing aging infrastructure to maintain reliability.
According to the EEI Actual and Planned Transmission Investments by Investor Owned Utilities (2009-2018) Oct. 2015, transmission investments are projected at $22 billion in 2017 and $21 billion in 2018 driven by the need to ensure grid reliability, integration of renewable energy, and upgrade of aging infrastructure throughout the U.S.
Balance Sheet
Goldfield has stated, it will continue to, “Evaluate targeted, niche companies typically under the radar of industry acquirers”. The company is well positioned to seek out accretive acquisitions thanks to its strong balance sheet and ability to generate free cash flows. The company’s balance sheet ending December 31, 2016 shows that the company had cash and cash equivalents of $20.6 million and total debt of $22.3 million. Goldfield has grown its cash reserves through its operations from $8 million in December 2012, while its long-term debt has increased by just $2 million compared to December 2012.
| Fiscal Period (Amounts in Millions) | Dec16 |
| Cash And Cash Equivalents | 20.6 |
| Current Portion of Long-Term Debt | 6.1 |
| Long-Term Debt & Capital Lease Obligation | 16.2 |
(Source: Company reports)
Cash Flow
A look at the company’s trailing twelve-month cash flow statements below shows Goldfield’s generated $18.1 million (ttm) in operating cash flow. At the same time, the company had just $5 million (ttm) in capex, which equates to $13.1 million (ttm) in free cash flow. With a current market cap of $136 million that means Goldfield’s has a FCF/Price yield of 10% (ttm).
| Fiscal Period (Amounts in Millions) | Dec16 | Sep16 | Jun16 | Mar16 |
| Cash Flow from Operations | 7.7 | 6 | 7.1 | -2.7 |
| Capital Expenditure | -2.1 | -1.7 | -0.7 | -0.5 |
| Free Cash Flow | 5.6 | 4.3 | 6.4 | -3.2 |
(Source: Company reports)
Summary
Goldfield Corporation is a micro-cap company that is growing and has been profitable for years. That can be a rare find in today’s seemingly overbought market. Goldfield reported record revenues for the fifth consecutive year, and has a 5 year CAGR of 15% when it comes to projects awarded.
The company has a healthy backlog and is well positioned to capitalize on some favorable industrial trends, which include President Trump’s plan to prioritize and jumpstart infrastructure projects around the country, and projected transmission investments by EEI members.
Goldfield’s has a strong balance sheet and solid free cash flows and has started to generate interest from several institutions with thirteen new institutional shareholders as of December 31, 2016.
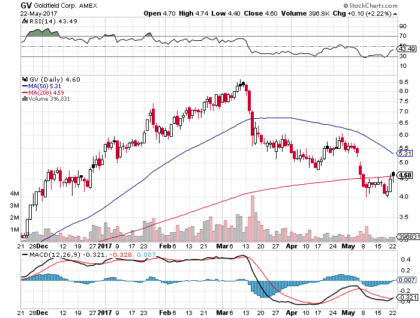
52 week range $2.54 – $8.65
Current $4.60/share
Goldfield has strong fundamentals and will likely continue to grow EBITDA. It appears that much of this growth has not yet been priced in. Goldfield is currently trading on a Free cash flow/Price Yield of 10% (ttm), a FCF/Enterprise Value Yield of 10% (ttm). Additionally, the company’s current P/E of 10, compared to its 5Y average of 14.5, could be indicators that Goldfield is undervalued.
About Traders News Source
Welcome to Traders News Source Small Cap Research (see our track record below)
Expect 3-4 small cap profiles per month consisting of two emails per week. We do not spam or send emails daily, we understand that is annoying! Our reports are only sent when we see an actionable situation and potential for near term gains.
Traders News Source recent profiles and track record, 534% in verifiable potential gains for our members on 3 small cap alerts alone!
January 31st, 2017 (NASDAQ: HIMX) opened at $5.10/share and hit a high of $9.68/share March 24th, 2017 for gains of 89% within 60 days- http://finance.yahoo.com/news/himax-technologies-review-4q-2016-130000319.html
February 6th, 2017- (NASDAQ: SCON) opened at $1.12/share hit a high of $1.80/share within 10 days our member potential gains- 60% – http://finance.yahoo.com/news/superconductor-technologies-potential-revolutionize-smart-130000844.html
March 6th, 2017 (OTC: USRM) opened at .035/share and hit over .17/share within 25 days for gains of 385% for our members- http://finance.yahoo.com/news/traders-news-issues-comprehensive-report-130000743.html
These are numbers that make traders drool. Any trader in any market would fall all over themselves to see numbers like this. So, if you’ve been on the fence, perhaps it’s time to start doing some research and verify our numbers for yourself. We are constantly raising the bar and separate ourselves from the rest of the small-cap newsletters as the best in business.
We know with a large following comes a large responsibility as we have everyone from institutional investors to the beginner following our profiled securities in our newsletters. This is something we take very seriously always seeking small cap growth companies that have both near and long-term potential for our members.
Limited Time Offer VIP Mobile Alerts
***Get our small cap profiles, special situation and watch alerts in real time. We are now offering our VIP – SMS/text alert service for free, simply text the word “Traders” to the phone number “25827” from your cell phone***
Disclaimer
Traders News Source is a wholly owned subsidiary of Traders News Source LLC, herein referred to as TNS LLC.
Traders News Source has not been compensated for this report by anyone and the opinions if any are that of the author. Author’s Disclosure: I, Mark Roberts have no positions in any stocks mentioned, and no plans to initiate any positions within the next 72 hours. I, wrote this article myself, and it expresses my own opinions. I have no business relationship with any company whose stock is mentioned in the article.
This web site, published by TNS LLC, and is an investment newsletter that is built on the premise of assisting individual investors in learning about investing. Our goal as publishers of financial information is to provide research and analysis of investments to our subscribers. TNS LLC does not give buy or sell recommendations. We do purchase distribution rights from analyst, financial writers and bloggers for a fee that may be licensed to issue price targets and recommendations. Furthermore, we encourage you to speak to a licensed professional prior to making an investment in any type of publicly traded security.
We do sell advertising to other companies including brokerage firms, web sites, publicly traded issuers, investor relations firms, and investment publications, among others. TNS LLC makes no warranty as to the policies of these organizations, and in no way endorses their offers, services, or the content of their advertisements.
When an advertiser is a publicly traded company or a third party acting on behalf of a public company, we fully disclose all compensation in the email advertisement. Such disclosure is included in a disclosure statement in each of the advertisements sent via email.
17B Disclosure
Our reports/releases are a commercial advertisement and are for general information purposes ONLY. We are engaged in the business of marketing and advertising companies for monetary compensation. Never invest in any stock featured on our site or emails unless you can afford to lose your entire investment. The disclaimer is to be read and fully understood before using our services, joining our site or our email/blog list as well as any social networking platforms we may use.
PLEASE NOTE WELL: TNS LLC and its employees are not a Registered Investment Advisor, Broker Dealer or a member of any association for other research providers in any jurisdiction whatsoever.
Release of Liability: Through use of this website viewing or using you agree to hold TNS LLC, its operator’s owners and employees harmless and to completely release them from any and all liability due to any and all loss (monetary or otherwise), damage (monetary or otherwise), or injury (monetary or otherwise) that you may incur. The information contained herein is based on sources which we believe to be reliable but is not guaranteed by us as being accurate and does not purport to be a complete statement or summary of the available data. TNS LLC encourages readers and investors to supplement the information in these reports with independent research and other professional advice. All information on featured companies is provided by the companies profiled, or is available from public sources and TNS LLC makes no representations, warranties or guarantees as to the accuracy or completeness of the disclosure by the profiled companies. None of the materials or advertisements herein constitute offers or solicitations to purchase or sell securities of the companies profiled herein and any decision to invest in any such company or other financial decisions should not be made based upon the information provide herein. Instead TNS LLC strongly urges you conduct a complete and independent investigation of the respective companies and consideration of all pertinent risks. Readers are advised to review SEC periodic reports: Forms 10-Q, 10K, Form 8-K, insider reports, Forms 3, 4, 5 Schedule 13D.
TNS LLC is compliant with the Can Spam Act of 2003. TNS LLC does not offer such advice or analysis, and TNS LLC further urges you to consult your own independent tax, business, financial and investment advisors. Investing in micro-cap and growth securities is highly speculative and carries an extremely high degree of risk. It is possible that an investor’s investment may be lost or impaired due to the speculative nature of the companies profiled.
The Private Securities Litigation Reform Act of 1995 provides investors a ‘safe harbor’ in regard to forward-looking statements. Any statements that express or involve discussions with respect to predictions, expectations, beliefs, plans, projections, objectives, goals, assumptions or future events or performance are not statements of historical fact may be “forward looking statements”. Forward looking statements are based on expectations, estimates, and projections at the time the statements are made that involve a number of risks and uncertainties which could cause actual results or events to differ materially from those presently anticipated. Forward looking statements in this action may be identified through use of words such as “projects”, “foresee”, “expects”, “will”, “anticipates”, “estimates”, “believes”, “understands”, or that by statements indicating certain actions & quote; “may”, “could”, or “might” occur.
Understand there is no guarantee past performance will be indicative of future results. In preparing this publication, TNS LLC has relied upon information supplied by its customers, publicly available information and press releases which it believes to be reliable; however, such reliability cannot be guaranteed. Investors should not rely on the information contained in this website. Rather, investors should use the information contained in this website as a starting point for doing additional independent research on the featured companies. The advertisements in this website are believed to be reliable, however, TNS LLC and its owners, affiliates, subsidiaries, officers, directors, representatives and agents disclaim any liability as to the completeness or accuracy of the information contained in any advertisement and for any omissions of materials facts from such advertisement. TNS LLC is not responsible for any claims made by the companies advertised herein, nor is TNS LLC responsible for any other promotional firm, its program or its structure.