Flex Ltd. (NASDAQ: FLEX) is the Sketch-to-Scale® solutions provider that designs and builds Intelligent Products for a Connected World®. With approximately 200,000 professionals across 30 countries, Flex provides innovative design, engineering, manufacturing, real-time supply chain insight, and logistics services to companies of all sizes in various industries and end-markets.
On Oct. 25, 2018, Flex announced results for its second quarter ended September 28, 2018.
Key highlights of the quarter:
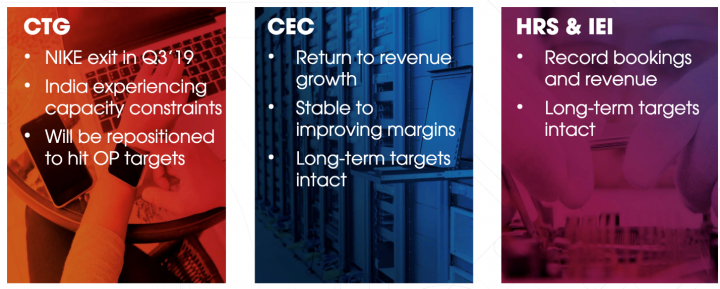
- HRS and IEI businesses both are coming off record bookings and record revenue, both are operating in their long-term margin ranges and will continue to contribute to overall growth as the company goes forward.
- Flex’s CEC business is improving ahead of schedule. This was a very strong quarter for CEC, and the outlook remains encouraging.
- CTG business is underperforming. The management is focused on returning CTG to its margin range.
- The Company took the first step with the decision to wind down its NIKE Mexico facility.
- Flex is actively working to focus the remaining CTG business on opportunities that fit its targeted margin profile of 2% to 4%.
NIKE Update: The Company has worked hard with NIKE to make the footwear manufacturing operations in Mexico technically and commercially successful. In recent weeks, however, it became clear that the Company would be unable to reach a commercially viable solution. Accordingly, Flex and NIKE have mutually agreed to wind-down the footwear manufacturing operations in Guadalajara by December 31, 2018. The Company is in the process of finalizing the terms and details of the wind-down and is striving hard to retain many of the affected employees and repurpose the facility. In connection with the wind-down of the operation, the Company recognized $30 millions of exit costs primarily related to an estimated impairment of fixed assets. The Company may incur additional costs to complete the wind-down.
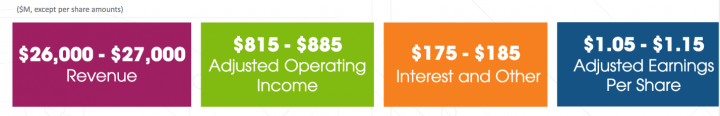
Management’ outlook: Flex’s updated fiscal guidance is for revenue of $26 billion to $27 billion, adjusted operating income of $815 million to $885 million and adjusted EPS of $1.05 to $1.15. The full-year GAAP EPS is expected to be in the range of $0.75 to $0.85, primarily as a result of stock-based compensation expense and intangible amortization and other charges.
Analyst tracking the stock believes that the company’ business risk profile derive strength from its powerful platform and a strong competitive position. Flex is expected to continue to improve and invest in its platform to provide exceptional value to the stakeholders. It’s fiscal 2018 yielded record bookings which will drive exceptional revenue growth.
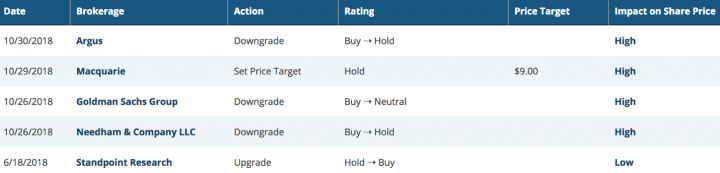
Analyst ratings and target price: Per www.marketbeat.com, Their average twelve-month price target is $18.2143, suggesting that the stock has a possible upside of 121.85%. The high price target for FLEX is $22.00, and the low-price target for FLEX is $9.00. There are currently five hold ratings, and 5 buy ratings for the stock, resulting in a consensus rating of “Buy.”
Below are the excerpts of recent analyst rating/Price targets on the company:
About the company: Flex is a globally-recognized, provider of Sketch-to-Scale services – innovative design, engineering, manufacturing, and supply chain services and solutions – from conceptual sketch to full-scale production. The Company design, build, ship and service complete packaged consumer and enterprise products, for companies of all sizes in various industries and end-markets, through its activities in the following segments:
Divisions:
- Communications & Enterprise Compute (“CEC”), which includes telecom business of radio access base stations, remote radio heads, and small cells for wireless infrastructure; networking business which includes optical, routing, broadcasting, and switching products for the data and video networks; Flex’s server and storage platforms for both enterprise and cloud-based deployments; next-generation storage and security appliance products; and rack level solutions, converged infrastructure and software-defined product solutions;
- Consumer Technologies Group (“CTG”), which includes consumer-related businesses in connected living, wearables, gaming, augmented and virtual reality, and mobile devices; and including various supply chain solutions for notebook personal computers, tablets, and printers;
- Industrial and Emerging Industries (“IEI”), which is comprised of energy including advanced metering infrastructure, energy storage, smart lighting, electric vehicle infrastructure, smart solar energy, semiconductor and capital equipment, office solutions, industrial, home and lifestyle, industrial automation, and kiosks; and
- High-Reliability Solutions (“HRS”), which is comprised of health solutions business, including consumer health, digital health, disposables, precision plastics, drug delivery, diagnostics, life sciences and imaging equipment; automotive business, including vehicle electrification, connectivity, autonomous vehicles, and clean technologies.
The portfolio is Diversified, Balanced and Scaling: Business segments and segmental updates:
Second Quarter 2018 Highlights:
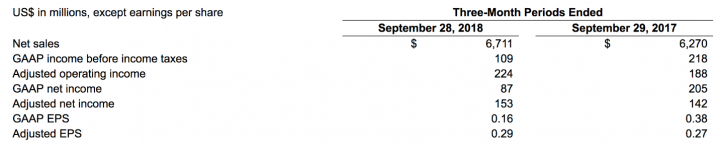
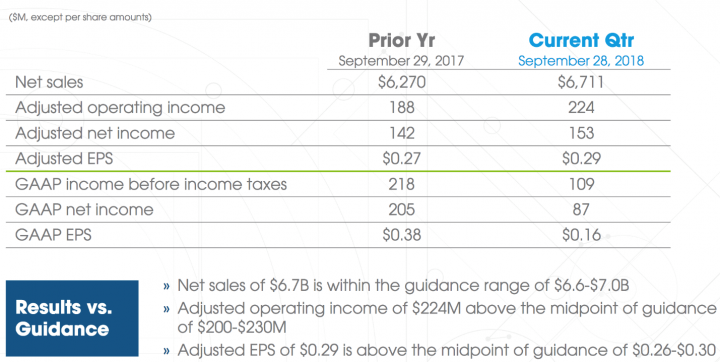
Revenue: Net sales for the second quarter ended September 28, 2018, were $6.7 billion, growing 7% year-over-year, and within the guidance range of $6.6 to $7.0 billion. GAAP income before income taxes was $109 million for the quarter and adjusted operating income was $224 million, above the midpoint of the guidance range of $200 million to $230 million. GAAP net income was $87 million and adjusted net income for the quarter was $153 million. GAAP net income per share was $0.16 for the quarter, and adjusted EPS was $0.29 for the quarter.
Liquidity:
- Flex ended the quarter with approximately $1.38 billion of cash on hand and total debt of approximately $2.9 billion. The balance sheet remains well positioned to support the business over the long term.
- Flex’s cash from operations was negative $764 million and negative $1.7 billion for the three and six-month periods ended September 28, 2018, respectively, and reflects the impacts due to cash collections under ABS programs of the deferred purchase price for receivables sold of $885 million and $1.8 billion for those respective periods that due to a recent accounting change are now included as investing cash activities. Adjusted to exclude the impacts from the new accounting noted above, cash from operations was $120 million and $105 million for the three and six-month periods ended September 28, 2018, respectively.
- The Company remains committed to return over 50% of annual free cash flow to its shareholders as it repurchased ordinary shares for approximately $60 million during the three months ended September 28, 2018.
Updated Fiscal 2019 Guidance:
Commentary on annual guidance:
- The Company’s Consumer Technology Group’s forecasted performance accounts for the majority of the downward revision Reflects constrained facility capacity in India and incremental pressures in auto and industrial businesses
- Reflects incremental headwinds from component shortage and an uncertain tariff environment GAAP EPS is in the range of $0.75- $0.85 based on GAAP income before taxes of $450 – $550 million.
- The adjusted income tax rate remains in the mid-point of 10% – 15% for the full fiscal year. WASO is expected to be approximately 534 million shares.
Quarterly guidance: For the third quarter ending December 31, 2018, revenue is expected to be in the range of $6.6 to $7.0 billion. Adjusted EPS is expected to be in the range of $0.29 to $0.33 per diluted share. GAAP EPS is expected to be in the range of $0.19 to $0.23 and includes primarily stock-based compensation expense and intangible amortization.
Key risk factors and potential stock drivers:
- The company needs incremental capital to expand, achieve revenue targets. Therefore, management’ ability to improve Flex’ cash flow profile as the company goes forward would continue to remain a critical stock sensitivity factor.
- Company’ ability to demonstrate strong financial performance despite competitive pressures
- Weaker than expected revenue growth and or profitability could also impinge the stock performance over the near to medium term.
- Company’ ability to maintain liquidity and financial flexibility to fund its incremental capital requirements will remain a critical challenge for the company.
Stock Performance
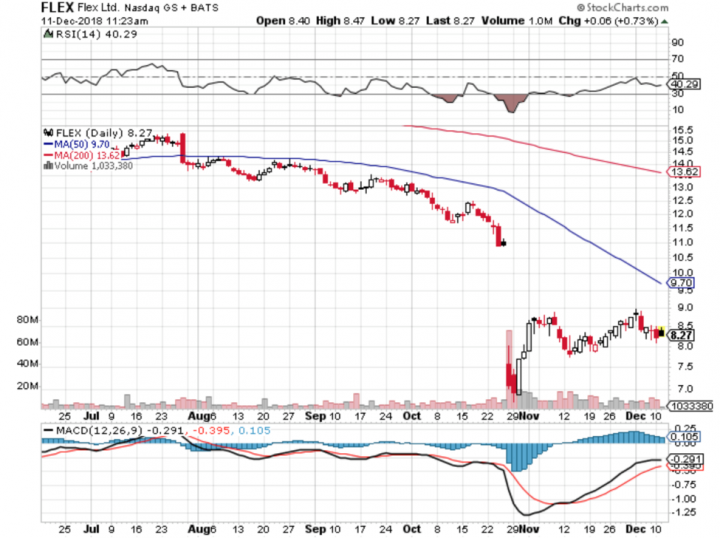
Comments:
- On Tuesday, Dec 11th, 2018, FLEX is trading at $8.27, with an average daily volume of 8.37 million shares exchanging hands. Market capitalization is $4.357 billion. The current RSI is 40.29.
- In the past 52 weeks, shares of FLEX have traded as low as $6.74 and as high as $19.71
- At $8.28, shares of FLEX are trading below its 50-day moving average (MA) at $9.70 and below its 200-day moving average (MA) at $13.62
- The present support and resistance levels for the stock are at $7.84 & $8.70 respectively.