Cleantech Solutions International Inc. (NASDAQ: CLNT), through its affiliated companies, designs, manufactures and distributes a line of proprietary high and low temperature dyeing and finishing machinery to the textile industry.
The company is being acquired by YSK1860 (an investment holding Company). Pursuant to the terms of the agreement, YSK1860 purchased all shares of Cleantech previously held by the company’s Chairman and CEO, Mr. Jinhua Wu, and his affiliates. It acquired 416,249 shares for about $970 million, or $2.33 per share.
As per management, Mr. Wu and his affiliates decision to sell their shares was based on personal factors, and Mr. Wu will continue to retain his positions as Chairman and CEO of Cleantech Solutions going forward.
Dr. Thomas Chan, director of YSK1860, said, “This investment in Cleantech Solutions demonstrates our trust and confidence in the US stock market and the Company for its long-term growth potential and opportunity to participate in the growing Chinese energy market. We also expect to leverage our investment expertise and connections in the technology, media and telecommunications sectors to support Cleantech Solutions in identifying new business opportunities in the future. We are confident in the current management’s ability to put this year of transition behind us and focus on improving the long-term business outlook.”
This event has infused significant liquidity in the company and the stock has spiked more than 70% following the news. The company, say experts, looks like a good bet considering recent developments along with its longstanding track-record of operations and strategic operational decisions that the company has taken.
On April 17th, CLNT announced financial results for year ended December 31, 2016. Revenue decreased by 40.1% to $17.4 million. Revenues declined due to an anticipated slowdown in shipments of low-emission airflow dyeing machines. Additionally, the business was also affected by government actions requiring textile manufacturers in Zhejiang province to temporarily cease operations. Gross profit for 2016 was $2.5 million, compared to gross profit of $6.5 million for 2015. The company experienced a decline in margin that was attributable to a reduced scale of operations. Net loss for 2016 was $11.7 million, or $(9.79) per basic and diluted share, compared to net loss of $12.8 million, or $(12.97) per basic and diluted share, in 2015. Company’s core dyeing machine business felt the impact of China’s difficult economic environment.
As per management, 2016 was a year of transition for Cleantech Solutions. With its forged rolled rings and related components and petroleum and chemical equipment segments continuing to perform poorly, it decided to exit these two segments.
Management believe that its focus on the dyeing equipment business, developing next generation dyeing and finishing equipment based on CLNT’s recently acquired ozone-ultrasonic patent technology, will usher in significant benefits in the logistics chain across sectors.
Moreover, there would also be increased synergies due to Cleantech’s recent investment in Wuxi Shengxin New Energy Engineering Co., Ltd. (“Shengxin”), a newly formed company that plans to build solar farms in Guizhou and Yunnan provinces.
Analysts expect the ongoing traction in the company’s operations and incremental revenue from the newly acquired businesses to support the growth momentum of the company over the near to medium term. For the first quarter of 2017 (results due 5-16-17), CLNT expects that its revenues will remain at or about its’ current level in the near future, although declines are possible.
With the recent developments, we believe the company’s stock is categorized as ‘HOLD’. That being said, the company is reflecting reasonable bullish signs and has a near term price target of $5.45/share.
Recent events in detail:
YSK1860, an investment holding company with investments in different countries covering diverse sectors from infrastructure, construction, real estate, trading to environmental and the Internet, acquired all of the shares of Cleantech previously held by Cleantech Solutions’ Chairman and CEO, Mr. Jinhua Wu, and his affiliates.
YSK1860 purchased 416,249 shares of Cleantech Solutions stock from Mr. Wu and his affiliates for $970,000, or $2.33 per share. Mr. Wu and his affiliate’s decision to sell their shares were based on personal reasons, and Mr. Wu will retain his positions as Chairman and CEO of Cleantech Solutions going forward.
Discontinued operations: During December, CLNT sold 100% ownership in Wuxi Fulland Wind Energy Equipment Co., Ltd and discontinued its forged rolled rings and related components business.
Additionally, management decided to discontinue its petroleum and chemical equipment segment due to significant declines in revenues and the loss of its major customer.
Therefore, assets and liabilities of these two segments have been classified on the consolidated balance sheet as assets and liabilities of discontinued operations as of December 31, 2016 and 2015 and the operating results have been classified as discontinued operations in the consolidated statements of operations for all years presented.
In March 2017, the Company sold certain manufacturing equipment that was previously used in the discontinued petroleum and chemical segment. These assets amounted to approximately $1.1 million, which were included in the assets of discontinued operations on the consolidated balance sheets at December 31, 2016
Stock split: Cleantech avoided delisting by the NASDAQ through the use of a 1:4 reverse stock-split effective March 20, 2017.
2016 Results
- Earnings: Revenue for 2016 decreased by 40.1% to $17.4 million, as against $29.0 million for 2015.
Rationale for muted growth in revenue: Cleantech’s only source of revenue was its dyeing and finishing business, since forged rolled rings and related products and petroleum and chemical equipment businesses reflected as discontinued operations.
Revenues declined due to an anticipated slowdown in shipments of low-emission airflow dyeing machines as many companies in the dyeing industry had already upgraded to new models and did not require additional equipment, and orders for new low-emission airflow dyeing machines slowed down in 2016.
Business was also impacted by government actions requiring textile manufacturers in Zhejiang province to temporarily cease operations in order to improve air quality ahead of the G20 Summit in Hangzhou during September 2016.
- Profitability: Gross profit for the 2016 was $2.5 million, against $6.5 million for 2015. Gross margin was 14.7% during 2016 compared to 22.4% for 2015. The decline was led by reduced scale of operations and increase in raw material costs.
For the years ended December 31, 2016 and 2015, company recorded bad debt expense (recovery) of $1,038,000 and $(52,000), respectively.
Loss from continuing operations was $1.4 million, or $(1.17) per basic and diluted share, compared to income from continuing operations of $3.0 million, or $3.04 per basic and diluted share in 2015.
Loss from discontinued operations was $10.3 million, or $(8.62) per basic and diluted share, which includes a $6.4 million loss on sales / disposal of discontinued operations. Against a loss from discontinued operations of $15.8 million, or $(16.01) in 2015.
Net loss for 2016 was $11.7 million, or $(9.79) per basic and diluted share, against a net loss of $12.8 million, or $(12.97) per basic and diluted share, in 2015.
- Liquidity: As of December 31, 2016, Cleantech Solutions held cash and cash equivalents of $1.5 million compared to $18.8 million at December 31, 2015.
In 2016, the Company used $6.9 million in cash in operations, primarily due to losses for the period. The Company used $10.5 million in cash in investing activities, including $9.0 million in payments for a 30% interest in Shengxin, $2.4 million to purchase of patent technology use rights covering ozone-ultrasonic textile dyeing equipment and $1.2 million for the purchase of equipment. This was partially mitigated by cash inflow by sale of the forged rolled rings and related components segment of $2.2 million.
Key risk factors and potential stock drivers:
For the year ended December 31, 2016, CLNT incurred losses from continuing operations of $1.4 million. Therefore, company’s ability to ramp-up profitability while sustaining its revenue growth would be one of the key stock drivers over the near to medium term.
Cleantech’s ability to maintain its liquidity and financial flexibility to fund its incremental capital requirements. Also, any additional equity raise is exposed to significant dilution risk.
The market for CLNT’ dyeing and finishing equipment is significantly dependent on competiveness of the Chinese textile industry. Therefore, to the extent Chinese textile companies either lose business or potential business to other countries or seek to manufacture in those countries, the market for CLNT’s equipment may decline significantly. Moreover, products are subject to PRC regulations, which may materially adversely affect business.
Stock Performance:
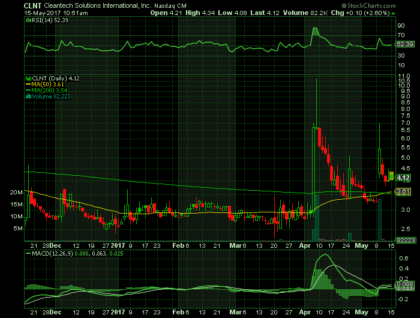
On Friday, May 12th, 2017, CLNT shares closed at $4.21 on an average volume of 1.73 million shares exchanging hands. Market capitalization is $4.4 million. The current RSI is 52.39
At $4.21, shares of CLNT are trading above its 50-day moving average (MA) at $3.61 and above its 200-day MA at $3.54.
The present support and resistance levels for the stock are at $3.78 & $4.45 respectively.
About Traders News Source
Limited Time Offer VIP Mobile Alerts
***Get our small cap profiles, special situation and watch alerts in real time. We are now offering our VIP – SMS/text alert service for free, simply text the word “Traders” to the phone number “25827” from your cell phone***
Welcome to Traders News Source Small Cap Research (see our track record below)
Expect 3-4 small cap profiles per month consisting of two emails per week. We do not spam or send emails daily, we understand that is annoying! Our reports are only sent when we see an actionable situation and potential for near term gains.
Traders News Source recent profiles and track record, 534% in verifiable potential gains for our members on 3 small cap alerts alone!
January 31st, 2017 (NASDAQ: HIMX) opened at $5.10/share and hit a high of $9.68/share March 24th, 2017 for gains of 89% within 60 days- http://finance.yahoo.com/news/himax-technologies-review-4q-2016-130000319.html
February 6th, 2017- (NASDAQ: SCON) opened at $1.12/share hit a high of $1.80/share within 10 days our member potential gains- 60% – http://finance.yahoo.com/news/superconductor-technologies-potential-revolutionize-smart-130000844.html
March 6th, 2017 (OTC: USRM) opened at .035/share and hit over .17/share within 25 days for gains of 385% for our members- http://finance.yahoo.com/news/traders-news-issues-comprehensive-report-130000743.html
These are numbers that make most traders drool. Any trader in any market would fall all over themselves to see numbers like this. So, if you’ve been on the fence, perhaps it’s time to start doing some research and verify our numbers for yourself. We are constantly raising the bar and separate ourselves from the rest of the small-cap newsletters as the best in business.
We know with a large following comes a large responsibility as we have everyone from institutional investors to the beginner following our profiled securities in our newsletters. This is something we take very seriously always seeking small cap growth companies that have both near and long-term potential for our members.
Disclaimer
Traders News Source is a wholly owned subsidiary of Traders News Source LLC, herein referred to as TNS LLC.
Traders News Source has not been compensated for this report by anyone and the opinions if any are that of the author Vikas Agrawal, CFA. Author’s Disclosure: I have no positions in any stocks mentioned, and no plans to initiate any positions within the next 72 hours. I, wrote this article myself, and it expresses my own opinions. I have no business relationship with any company whose stock is mentioned in the article.
This web site, published by TNS LLC, and is an investment newsletter that is built on the premise of assisting individual investors in learning about investing. Our goal as publishers of financial information is to provide research and analysis of investments to our subscribers. TNS LLC does not give buy or sell recommendations. We do purchase distribution rights from analyst, financial writers and bloggers for a fee that may be licensed to issue price targets and recommendations. Furthermore, we encourage you to speak to a licensed professional prior to making an investment in any type of publicly traded security.
We do sell advertising to other companies including brokerage firms, web sites, publicly traded issuers, investor relations firms, and investment publications, among others. TNS LLC makes no warranty as to the policies of these organizations, and in no way endorses their offers, services, or the content of their advertisements.
When an advertiser is a publicly traded company or a third party acting on behalf of a public company, we fully disclose all compensation in the email advertisement. Such disclosure is included in a disclosure statement in each of the advertisements sent via email.
17B Disclosure
Our reports/releases are a commercial advertisement and are for general information purposes ONLY. We are engaged in the business of marketing and advertising companies for monetary compensation. Never invest in any stock featured on our site or emails unless you can afford to lose your entire investment. The disclaimer is to be read and fully understood before using our services, joining our site or our email/blog list as well as any social networking platforms we may use.
PLEASE NOTE WELL: TNS LLC and its employees are not a Registered Investment Advisor, Broker Dealer or a member of any association for other research providers in any jurisdiction whatsoever.
Release of Liability: Through use of this website viewing or using you agree to hold TNS LLC, its operator’s owners and employees harmless and to completely release them from any and all liability due to any and all loss (monetary or otherwise), damage (monetary or otherwise), or injury (monetary or otherwise) that you may incur. The information contained herein is based on sources which we believe to be reliable but is not guaranteed by us as being accurate and does not purport to be a complete statement or summary of the available data. TNS LLC encourages readers and investors to supplement the information in these reports with independent research and other professional advice. All information on featured companies is provided by the companies profiled, or is available from public sources and TNS LLC makes no representations, warranties or guarantees as to the accuracy or completeness of the disclosure by the profiled companies. None of the materials or advertisements herein constitute offers or solicitations to purchase or sell securities of the companies profiled herein and any decision to invest in any such company or other financial decisions should not be made based upon the information provide herein. Instead TNS LLC strongly urges you conduct a complete and independent investigation of the respective companies and consideration of all pertinent risks. Readers are advised to review SEC periodic reports: Forms 10-Q, 10K, Form 8-K, insider reports, Forms 3, 4, 5 Schedule 13D.
TNS LLC is compliant with the Can Spam Act of 2003. TNS LLC does not offer such advice or analysis, and TNS LLC further urges you to consult your own independent tax, business, financial and investment advisors. Investing in micro-cap and growth securities is highly speculative and carries an extremely high degree of risk. It is possible that an investor’s investment may be lost or impaired due to the speculative nature of the companies profiled.
The Private Securities Litigation Reform Act of 1995 provides investors a ‘safe harbor’ in regard to forward-looking statements. Any statements that express or involve discussions with respect to predictions, expectations, beliefs, plans, projections, objectives, goals, assumptions or future events or performance are not statements of historical fact may be “forward looking statements”. Forward looking statements are based on expectations, estimates, and projections at the time the statements are made that involve a number of risks and uncertainties which could cause actual results or events to differ materially from those presently anticipated. Forward looking statements in this action may be identified through use of words such as “projects”, “foresee”, “expects”, “will”, “anticipates”, “estimates”, “believes”, “understands”, or that by statements indicating certain actions & quote; “may”, “could”, or “might” occur.
Understand there is no guarantee past performance will be indicative of future results. In preparing this publication, TNS LLC has relied upon information supplied by its customers, publicly available information and press releases which it believes to be reliable; however, such reliability cannot be guaranteed. Investors should not rely on the information contained in this website. Rather, investors should use the information contained in this website as a starting point for doing additional independent research on the featured companies. The advertisements in this website are believed to be reliable, however, TNS LLC and its owners, affiliates, subsidiaries, officers, directors, representatives and agents disclaim any liability as to the completeness or accuracy of the information contained in any advertisement and for any omissions of materials facts from such advertisement. TNS LLC is not responsible for any claims made by the companies advertised herein, nor is TNS LLC responsible for any other promotional firm, its program or its structure.