The Mosaic Company (NYSE: MOS) is one of the world’s leading producers and marketers of concentrated phosphate and potash crop nutrients. Mosaic is a single source provider of phosphate and potash fertilizers and feed ingredients for the global agriculture industry. Its largest potash operations are in Saskatchewan; its biggest phosphate mines are in south-central Florida.
On August 1st, MOS reported second quarter earnings. Mosaic has generated improving results during the second quarter as global demand for potash and phosphates remained strong.
Mosaic’s net sales in the second quarter of 2017 were $1.8 billion; up from $1.7 billion last year, with higher sales volumes offsetting lower phosphates realized prices. Operating earnings during the quarter were $95 million, up from $12 million a year ago, driven by higher phosphate and potash sales volumes, higher potash and international distribution segment margins.
Also helping the company was subdued Chinese production, where the phosphate industry has been restructuring and is expected to export fewer tons of phosphates this year, as compared with 2016. Driving the changes are Chinese concerns about air and water pollution and profit levels from some of its older and inefficient production facilities that need to be closed.
In the past few years, prices of key products have been oscillating at rock bottom levels, as farmers cut down fertilizer usage and other expenses in response to low crop prices and a weak farm economy and overall output.
As per management, a good portion of revenue declines in recent years have been offset by cost reductions and declining prices for raw materials and that the market is improving finally. The company said it sold 8.3 percent more diammonium phosphate and 10 percent more potash in the second quarter, compared with the same period in 2016.
From a financial flexibility perspective, the Cash flow provided by operating activities in the second quarter was $243 million compared to $584 million in the prior year. Mosaic’s total cash and cash equivalents, excluding restricted cash, were $661 million as of June 30, 2017.
MOS has witnessed relatively better business and financial performance in the second quarter and continues to make great progress toward closing the acquisition of Vale Fertilizantes. Post close; the company intends to prioritize its excess cash flow on paying down debt to return to its targeted leverage ratios.
Mosaic’s actions to lower costs and prudently manage capital have positioned the company to outperform as markets improve. It is executing well on its strategic objectives, as it continues to capitalize on the long-term improving trends and focus on opportunities to create value for shareholders.
With the recent developments, analyst have revised their outlook on the stock:
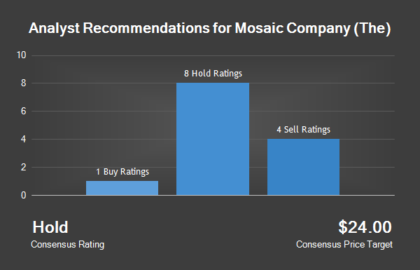
The consensus analyst price target for Mosaic is $24.80. The current consensus price target is more than 20% higher than the prevailing price.
About the Company: The Mosaic Company is one of the world’s leading producers and marketers of concentrated phosphate and potash crop nutrients. Mosaic is a single source provider of phosphate and potash fertilizers and feed ingredients for the global agriculture industry.
Major Products:
Potash: Mosaic has 9.3 million tons of operational capacity. Following completion of several expansion projects, Mosaic expects to have an annual operational capacity of approximately 15 million tons by 2021. Mosaic operates five potash mines.
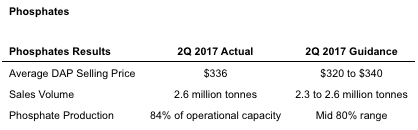
Phosphate
Mosaic is the largest producer of finished phosphate products with an annual capacity greater than the next two largest producers combined. It has a global distribution network made up of plants, port facilities, warehouses and sales offices.
Approximately one-third of the company’s phosphate product is shipped within North America, with the remainder exported globally through both PhosChem, an export association, and through its own distribution channel.
Mosaic’s phosphate products are created by reacting ammonia and phosphoric acid to produce a solid, granulated fertilizer. MAP and DAP can be applied directly to the soil using conventional spreading equipment.
Industrial Products: Mosaic’s potash products are used in a variety of industrial environments. Its potash products are used to produce potassium hydroxide, in snow and ice melting formulas, water softeners, oil-well drilling muds, metal electroplating, aluminum recycling and they are also used by food processors and pharmaceutical manufacturers.
Performance in detail:
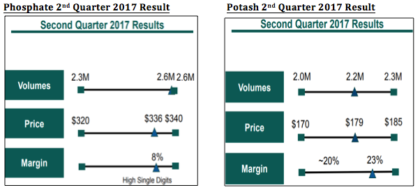
Phosphate: Net sales in the Phosphates segment were $975 million for the second quarter, essentially flat with $976 million last year, with higher sales volumes largely offsetting lower finished product prices. Gross margin was $76 million, or eight percent of net sales, compared to $100 million, or ten percent of net sales, for the same period a year ago.
Second quarter gross margin rate reflects lower finished product selling prices and higher ammonia costs compared to a year ago, partially offset by lower phosphate rock and sulfur costs. Ammonia costs for the quarter were negatively impacted by the previously announced Faustina ammonia production outage.
Mosaic’s North American finished phosphate production was 2.5 million tons, or 84 percent of operational capacity, compared to 2.4 million tons, or 82 percent a year ago.
Potash:
Potash results reflect excellent cost control, with margins improving both sequentially and year-over-year. Mosaic’s second quarter MOP cash costs were $77 per ton, including brine management costs, one of the lowest quarterly cost levels in recent history. Over the longer term, MOS expects the completion of the K3 project to further improve its position as a low cost global potash producer.
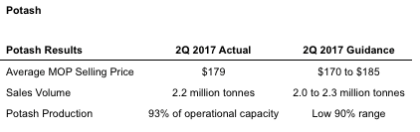
Net sales in the Potash segment totaled $468 million for the second quarter, up from $457 million last year, driven primarily by higher sales volumes. Gross margin was $110 million, or 23 percent of net sales, compared to $53 million, or 12 percent of net sales a year ago. The year-over-year increase in gross margin rate was primarily driven by lower costs of production because of both higher operating rates and lower plant spending.
Potash production was 2.3 million tons, or 93 percent of operational capacity, up from 1.8 million tons, or 67 percent of operational capacity last year.
International Distribution vertical:
Mosaic’s international distribution delivered solid results during the second quarter, as Brazil continues to import record levels of fertilizer
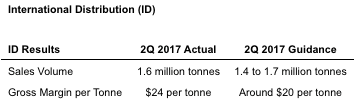
Net sales in the International Distribution segment were $583 million for the second quarter, up from $534 million last year, driven by higher sales volumes, partially offset by lower average selling prices. Gross margin was $39 million, or seven percent of net sales, compared to $5 million, or one percent of net sales for the same period a year ago.
First Quarter 2017 Financial Results:
Mosiac reported second quarter 2017 net income of $97 million, compared to a net loss of $10 million in the second quarter of 2016. Earnings per diluted share were $0.28, which included a negative impact of $0.01 from notable items.
Mosaic’s net sales in the second quarter of 2017 were $1.8 billion, up from $1.7 billion last year, with higher sales volumes offsetting lower phosphates realized prices.
Operating earnings during the quarter were $95 million, up from $12 million a year ago, driven by higher phosphate and potash sales volumes, higher potash and international distribution segment margins, partially offset by lower phosphate margins.
Segmental snapshot:
Cash flow provided by operating activities in the second quarter of 2017 was $243 million compared to $584 million in the prior year. Last year’s cash flow from operations benefited from positive changes in working capital. Capital expenditures totaled $169 million in the quarter. Mosaic’s total cash and cash equivalents, excluding restricted cash, were $661 million and long-term debt was $3.8 billion as of June 30, 2017.
Dividend declaration: Mosaic Company declared a quarterly dividend of $0.15 per share on the Company’s common stock. The dividend will be paid on September 21, 2017, to stockholders of record as of the close of business on September 7, 2017, and this indicates a $0.60 annual dividend and a payout of 2.92%.
Revised Outlook/Guidance over the near to medium term:
Phosphate Outlook: Total sales volumes for the Phosphates segment are expected to range from 2.2 to 2.5 million tons for the third quarter of 2017, compared to 2.5 million tons last year.
The segment gross margin rate in the third quarter is estimated to be in the range of seven to nine percent, and the operating rate is expected to be in the mid-80 percent range.
Potash Outlook: Total sales volumes for the Potash segment are expected to range from 1.9 to 2.2 million tons for the third quarter of 2017, compared to 2.2 million tons last year. Mosaic’s gross margin rate in the segment is expected to be in the range of 15 to 18 percent. The operating rate is expected to be in the low 80 percent range.
International Distribution Outlook: Total sales volumes for the International Distribution segment are expected to range from 2.3 to 2.6 million tons for the third quarter of 2017, compared to 2.2 million tons last year. The segment gross margin per ton is estimated to be in the low $20 range at the current Brazilian real exchange rate.
Other Outlook: The Corporate, Other and Eliminations segment is expected to provide a third quarter benefit from realizing the profit in inventory on products sold from Phosphates segment to International Distribution segment in the second quarter, ahead of the peak Brazilian demand season in the third quarter.
For calendar 2017, Mosaic now expects:
Canadian resource taxes to range from $90 to $110 million, narrowed from previous guidance of $85 to $135 million.
Bring management costs to range from $150 to $160 million, down from $160 to $180 million. Capital expenditures in the range of $800 to $850 million down from a range of $800 to $900 million.
Potash sales volumes in the range of 8.1 to 8.6 million tons, narrowed from 8.0 to 8.75 million tons.
Phosphates sales volumes in the range of 9.5 to 10 million tons, narrowed from 9.5 to 10.25 million tons.
International Distribution sales volumes in the range of 6.75 to 7.25 million tons, down from 7.0 to 7.5 million tons.
Guidance for SG&A expenses is unchanged and is expected to range from $295 to $310 million.
Key risk factors and potential stock drivers:
MOS is perceived to be on a rapid growth trajectory now. If the company can continue the momentum, it would result in a greater potential for capital appreciation.
The company’s ability to ramp-up profitability while sustaining its revenue growth would be one of the key stock driver over the near to medium term. The company must regulate its increasing costs.
Notwithstanding the management’s plan to reduce debt levels in future, Mosaic’s present financial position carries significant amounts of debt. The company is significantly vulnerable towards the risk related with adverse financial flexibility and liquidity.
MOS is expected to complete the transaction to acquire Vale Fertilizantes, the fertilizer unit of Brazilian company Vale SA. Upon closing the acquisition, it will add high-quality, low-cost assets. If the company can close this as envisaged i.e. without any major time & or cost overrun, it could be a positive trigger for the company.
Mosaic Co has its activities significantly dependent and vulnerable towards the agriculture industry. Its business involves production and marketing of crop enhancement products such as concentrated phosphate and potash crop nutrients. Therefore, any adverse development in the global or regional agricultural output will have a direct impact on the business risk profile of the company.
Mosaic is a commodity company that is largely exposed to macroeconomic factors that are totally outside of management’s control. Moreover, Mosaic sells products in global markets that face strong competition from other crop nutrient producers. Therefore, such macro factors would continue to impinge MOS’s business risk profile.
Stock Chart:
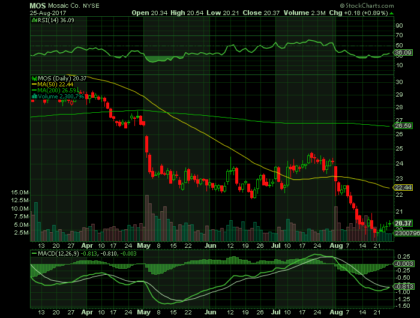
On Friday, August 25th, 2017, MOS closed at $20.37 (up 0.89%) on volume of 2.3 million shares exchanging hands. Market capitalization is $7.09 billion. The current RSI is 32.92
In the past 52 weeks, shares of MOS have traded as low as $19.59 and as high as $36.09.
At $20.19, shares of MOS are trading below its 50-day moving average (MA) at $22.48 and below its 200-day MA at $26.62
The present support and resistance levels for the stock are at $19.99 & $20.62 respectively.
***Get our small cap profiles, special situation and watch alerts in real time. We are now offering our VIP – SMS/text alert service for free, simply text the word “Traders” to the phone number “25827” from your cell phone***
Disclaimer
Traders News Source is a wholly owned subsidiary of Traders News Source LLC, herein referred to as TNS LLC.
Traders News Source has not been compensated for this report by anyone and the opinions if any are that of the author Vikas Agrawal, CFA. Author’s Disclosure: I have no positions in any stocks mentioned, and no plans to initiate any positions within the next 72 hours. I, wrote this article myself, and it expresses my own opinions. I have no business relationship with any company whose stock is mentioned in the article.
This web site, published by TNS LLC, and is an investment newsletter that is built on the premise of assisting individual investors in learning about investing. Our goal as publishers of financial information is to provide research and analysis of investments to our subscribers. TNS LLC does not give buy or sell recommendations. We do purchase distribution rights from analyst, financial writers and bloggers for a fee that may be licensed to issue price targets and recommendations. Furthermore, we encourage you to speak to a licensed professional prior to making an investment in any type of publicly traded security.
We do sell advertising to other companies including brokerage firms, web sites, publicly traded issuers, investor relations firms, and investment publications, among others. TNS LLC makes no warranty as to the policies of these organizations, and in no way endorses their offers, services, or the content of their advertisements.
When an advertiser is a publicly traded company or a third party acting on behalf of a public company, we fully disclose all compensation in the email advertisement. Such disclosure is included in a disclosure statement in each of the advertisements sent via email.
17B Disclosure
Our reports/releases are a commercial advertisement and are for general information purposes ONLY. We are engaged in the business of marketing and advertising companies for monetary compensation. Never invest in any stock featured on our site or emails unless you can afford to lose your entire investment. The disclaimer is to be read and fully understood before using our services, joining our site or our email/blog list as well as any social networking platforms we may use.
PLEASE NOTE WELL: TNS LLC and its employees are not a Registered Investment Advisor, Broker Dealer or a member of any association for other research providers in any jurisdiction whatsoever.
Release of Liability: Through use of this website viewing or using you agree to hold TNS LLC, its operator’s owners and employees harmless and to completely release them from any and all liability due to any and all loss (monetary or otherwise), damage (monetary or otherwise), or injury (monetary or otherwise) that you may incur. The information contained herein is based on sources which we believe to be reliable but is not guaranteed by us as being accurate and does not purport to be a complete statement or summary of the available data. TNS LLC encourages readers and investors to supplement the information in these reports with independent research and other professional advice. All information on featured companies is provided by the companies profiled, or is available from public sources and TNS LLC makes no representations, warranties or guarantees as to the accuracy or completeness of the disclosure by the profiled companies. None of the materials or advertisements herein constitute offers or solicitations to purchase or sell securities of the companies profiled herein and any decision to invest in any such company or other financial decisions should not be made based upon the information provide herein. Instead TNS LLC strongly urges you conduct a complete and independent investigation of the respective companies and consideration of all pertinent risks. Readers are advised to review SEC periodic reports: Forms 10-Q, 10K, Form 8-K, insider reports, Forms 3, 4, 5 Schedule 13D.
TNS LLC is compliant with the Can Spam Act of 2003. TNS LLC does not offer such advice or analysis, and TNS LLC further urges you to consult your own independent tax, business, financial and investment advisors. Investing in micro-cap and growth securities is highly speculative and carries an extremely high degree of risk. It is possible that an investor’s investment may be lost or impaired due to the speculative nature of the companies profiled.
The Private Securities Litigation Reform Act of 1995 provides investors a ‘safe harbor’ in regard to forward-looking statements. Any statements that express or involve discussions with respect to predictions, expectations, beliefs, plans, projections, objectives, goals, assumptions or future events or performance are not statements of historical fact may be “forward looking statements”. Forward looking statements are based on expectations, estimates, and projections at the time the statements are made that involve a number of risks and uncertainties which could cause actual results or events to differ materially from those presently anticipated. Forward looking statements in this action may be identified through use of words such as “projects”, “foresee”, “expects”, “will”, “anticipates”, “estimates”, “believes”, “understands”, or that by statements indicating certain actions & quote; “may”, “could”, or “might” occur.
Understand there is no guarantee past performance will be indicative of future results. In preparing this publication, TNS LLC has relied upon information supplied by its customers, publicly available information and press releases which it believes to be reliable; however, such reliability cannot be guaranteed. Investors should not rely on the information contained in this website. Rather, investors should use the information contained in this website as a starting point for doing additional independent research on the featured companies. The advertisements in this website are believed to be reliable, however, TNS LLC and its owners, affiliates, subsidiaries, officers, directors, representatives and agents disclaim any liability as to the completeness or accuracy of the information contained in any advertisement and for any omissions of materials facts from such advertisement. TNS LLC is not responsible for any claims made by the companies advertised herein, nor is TNS LLC responsible for any other promotional firm, its program or its structure.